logdistributor
Log Distributor
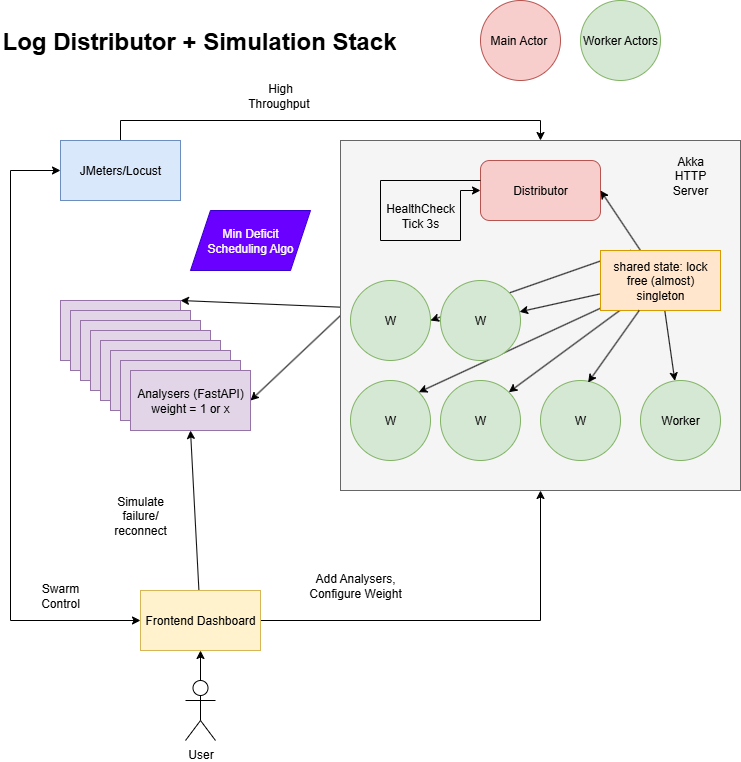
This repository implements a log packet distributor using Akka HTTP and FastAPI. It simulates a distributed system where log packets are sent to multiple analysers for processing. The system is designed to demonstrate weighted round-robin distribution of packets, health monitoring, and basic load testing.
Video Demos
- Cloning, Setup and Interacting with the Applcation
- Extensive Testing of various scenarios
- Technical Deep dive and walkthrough: Can be made available on request!
Associated Content
- Task and Deliverables
- Specification and Testing Results
- API Documentation
- Improvements and Future Work
Architecture Overview
Prerequisites
- Docker Engine and Docker Compose installed locally.
Running with Docker
Use Docker Compose to build the images and start the stack. The detached mode keeps the console uncluttered and gives slightly higher throughput because services do not write logs to the terminal. Without using --detach, you can see the logs in real time but in my local system the services would crash after a few minutes due to the large amount of output.
docker compose up --build --detach # build all images and run in the background
For subsequent runs when the images already exist you can skip the build step:
docker compose up --detach # start the existing containers in background
The services will be available on the following ports:
| Service | URL / Description |
|---|---|
| Analyser 1‑6 | http://localhost:8001 … 8006 |
| Distributor | http://localhost:8080 |
| Locust UI | http://localhost:8089 |
| Frontend | http://localhost:5173 |
Prometheus and Grafana definitions exist in the repository but are commented out in docker-compose.yaml. You can enable them by uncommenting the respective sections if you require metrics collection and dashboards.
Task and Deliverables
Define a data model for a log message and packet
- ApiDoc describes the data model for log messages and packets.
- Scala Data Model defines the data structures used in the Akka HTTP service.
- FastAPI Data Model defines the data model as used in the FastAPI service.
Develop a multi-threaded web server that accepts a post request for a log packet
- The Akka HTTP service in distributor/src/main/scala/com/kaushal1011/DistributorApp.scala implements the web server that accepts POST requests for log packets.
Design the logic for high-throughput non-blocking thread-safe distribution
- Throughput Results show that the system can handle high throughput with a maximum of around 5000 requests per second using JMeter and around 1800 requests per second using Locust.
Handle the condition of one or more analyzers going offline for a while, and then coming back online
- Failure and Recovery Testing demonstrates how the system handles analyser failures and recovery using the
/internal/simulate/failand/internal/simulate/beginendpoints.
Setup a working demo (e.g. docker compose w/ jmeter, but feel free to use whatever you would like) to show:
- The distribution respects the weights
- The distributor can handle an analyzer failing and coming back online
- The system can handle high throughput
Video Demo
- Video Demos are linked above in the readme, showing the system in action, including the frontend UI, load testing with Locust, and failure/recovery scenarios.
Include clear instructions on how to run the demo locally (e.g. we should be able to run your demo)
- Attached a video above.
# Start the Docker containers
docker compose up --build --detach
Give me a 1-page write-up on what other conditions you might want to handle or improvements you might want to add given more time, what would be your testing strategy, etc.
- Improvements and Future Work outlines potential improvements such as clustered setup for the distributor, better management of shared state, FastAPI with multiple workers, comprehensive testing suite, unit tests for individual components, and integration tests for end-to-end scenarios.
Tech stack
- Scala & Akka HTTP – the
distributorservice exposes HTTP routes and uses Akka Typed actors for a weighted round‑robin distribution of packets to analysers. - Python & FastAPI – each
analysercontainer provides an API to process log packets and exposes Prometheus metrics. - React & TypeScript (Vite) – the
frontendis a simple web application served on port5173. - Locust – containers
locust-masterandlocust-workergenerate traffic against the distributor for benchmarking. - Docker Compose – all services can be started together for a complete demo environment.
Testing the stack
With the services running you can send a sample packet to the distributor:
curl -X POST http://localhost:8080/distributor/packet \
  -H "Content-Type: application/json" \
  -d '{"id":"1","timestamp":0,"messages":[{"level":"INFO","message":"hello"}]}'
Locust will also start generating traffic automatically when the stack is up. Visit http://localhost:8089 to see the Locust dashboard.
Using the Frontend
Open http://localhost:5173 in your browser once the containers are running. The React web UI exposes several controls and charts:
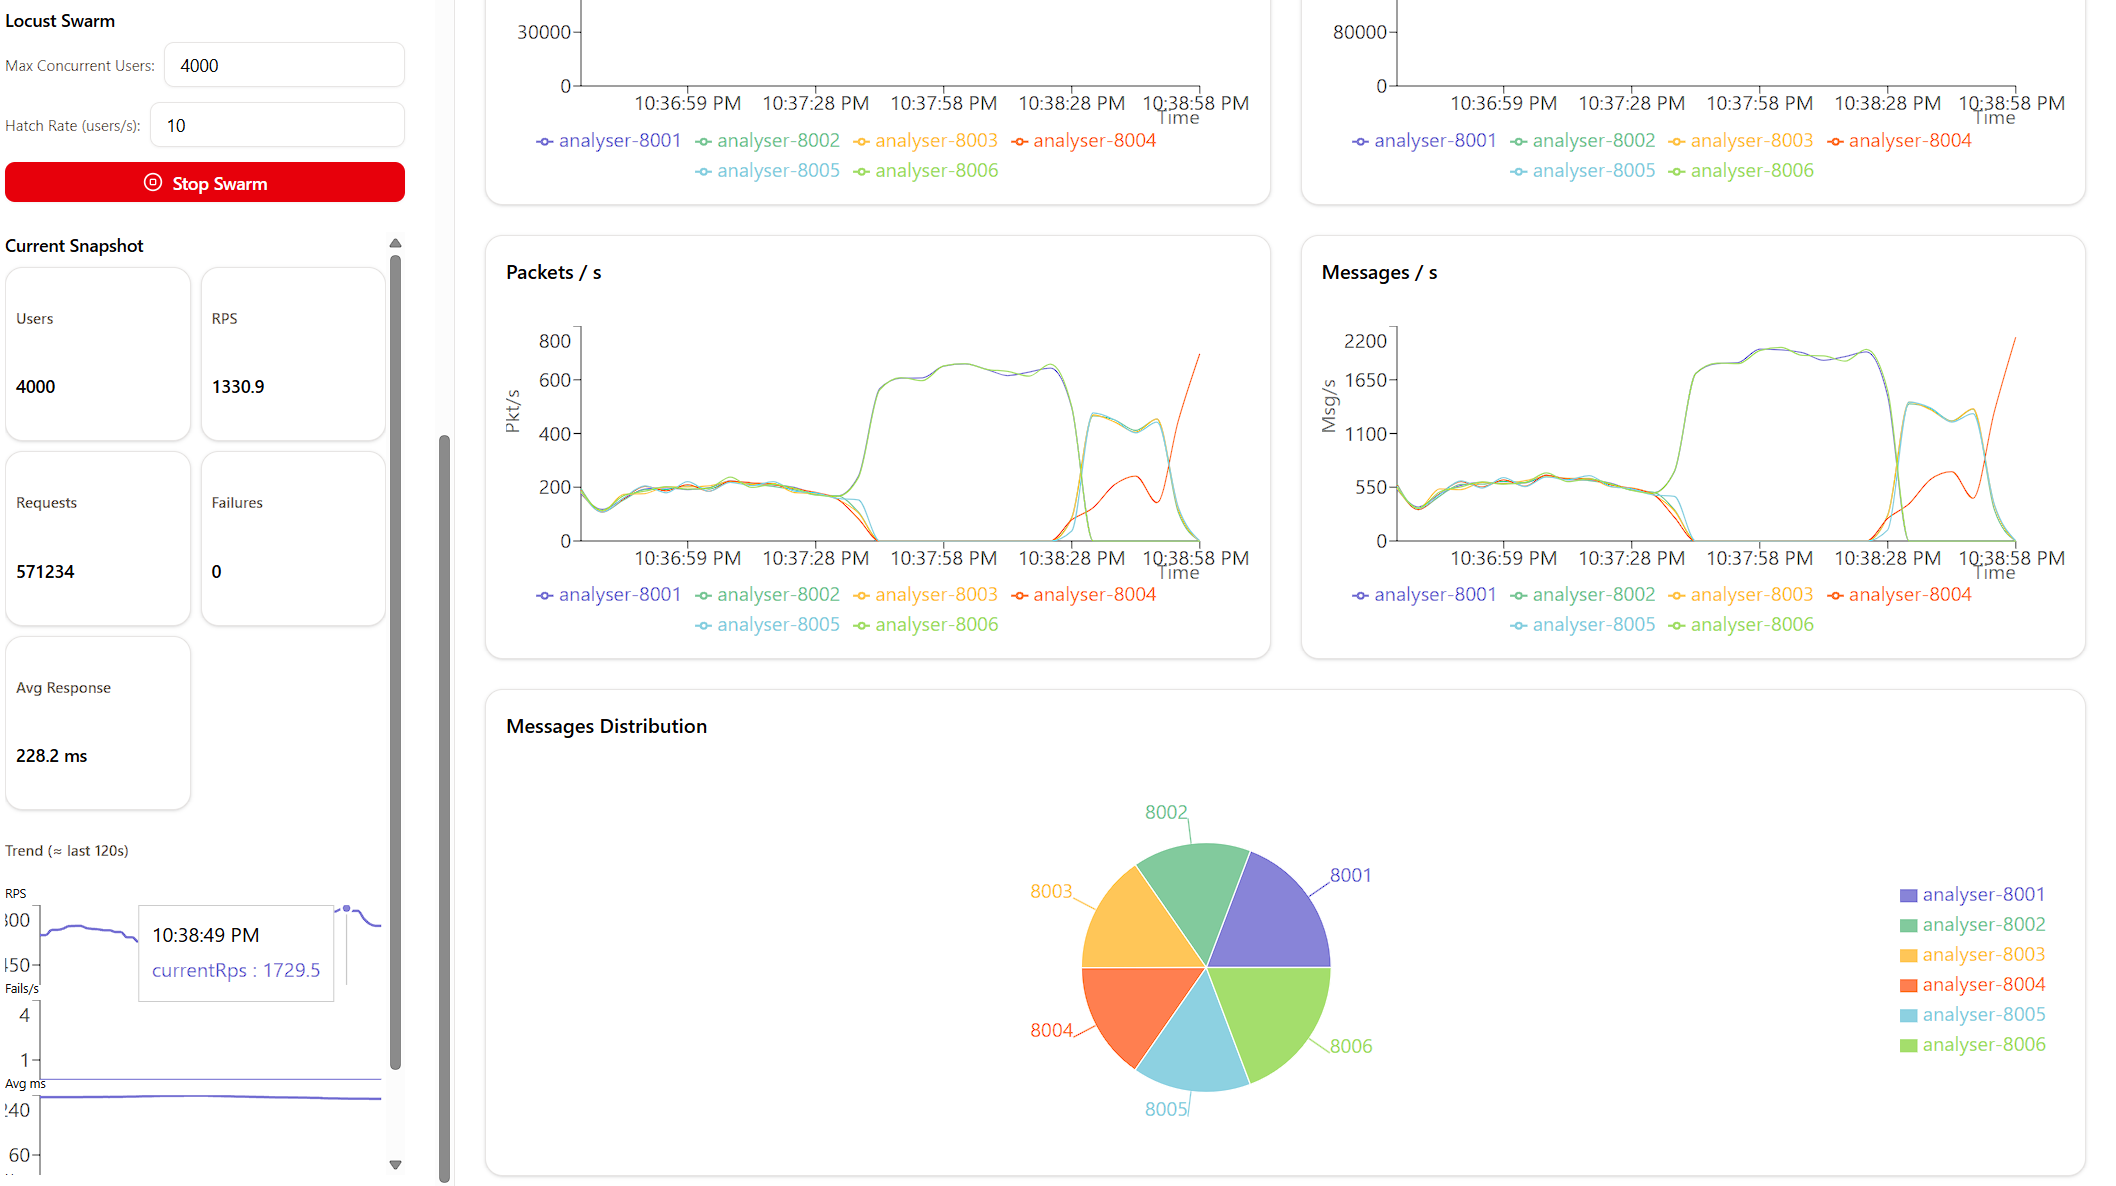
- Swarm Controls – start or stop the Locust swarm that sends random sized packets to the distributor. You can tweak the maximum user count and hatch rate. Live metrics such as requests per second and failures are displayed below.
- Analyser Controls – toggle individual analysers on or off to simulate failure and recovery. Each analyser exposes
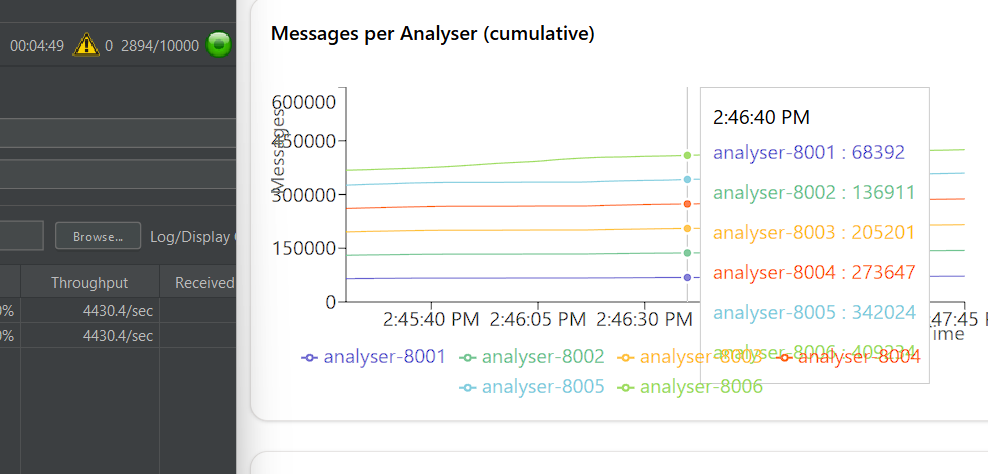
/internal/simulate/beginand/internal/simulate/failendpoints which the UI calls for you. - Dashboard Charts – view cumulative packets and messages processed by each analyser, packets per second and messages per second line charts, and a pie chart showing the message distribution. The pie chart is useful for confirming that weighted routing is working as expected.
Using these controls you can test scenarios such as taking an analyser offline during a swarm and observing how the distributor rebalances traffic.
Cleaning up
docker compose down
This stops and removes all containers.
Testing and Results
Load Testing (High Throughput)
I was able to capture a maximum load of around 5000 requests per second using JMeter, the test plan is included. Using Locust (which is integrated into the Docker Compose setup) I was able to achieve a maximum of around 1800 requests per second. The load testing script is located in locustfile.py.
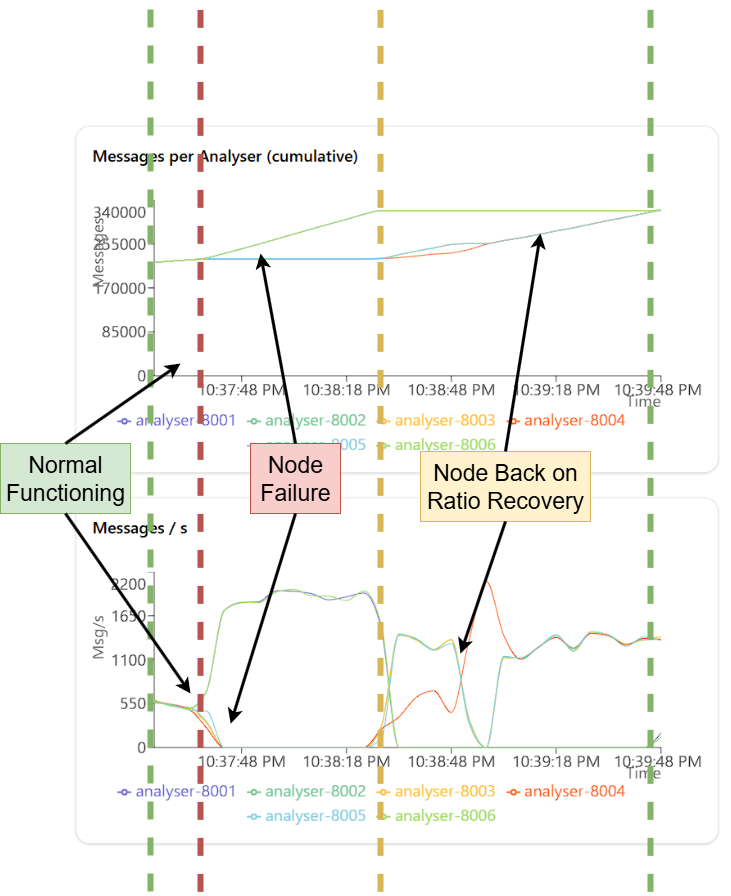
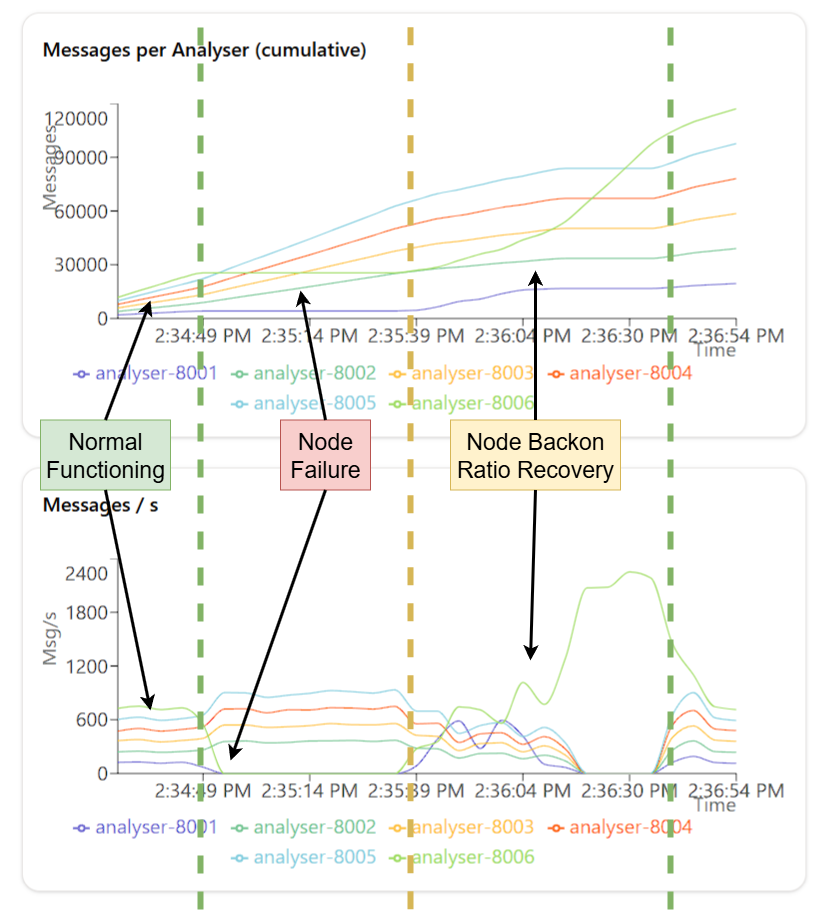
Failure and Recovery Testing
I tested the failure and recovery of analysers by simulating failures using the /internal/simulate/fail endpoint. This endpoint allows you to mark an analyser as down, and the distributor will stop routing packets to it. You can then use the /internal/simulate/begin endpoint to bring the analyser back online, and the distributor will resume routing packets to it. I tested on different ratios: 1:1 and 1:6
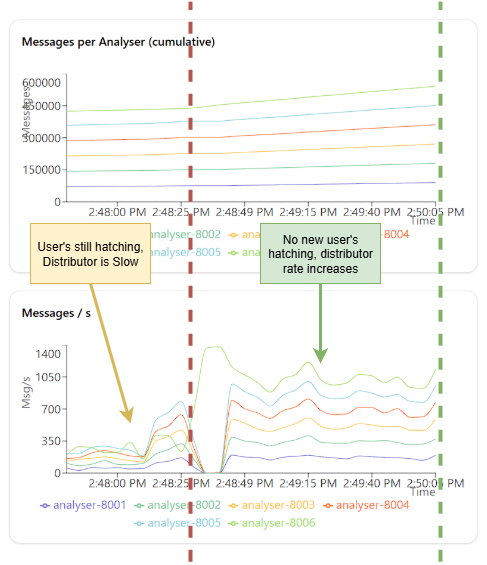
Throughput with Concurrent Requests
Interestingly, I observed that the throughput of the system increases when there are no new users hatching just old users putting several thousand requests. I think this may be how I have my Akka HTTP service configured, but it is worth noting that the throughput can be significantly higher when there are no new users hatching.
Repository structure
/                – top‑level Docker Compose file
/analyser        – FastAPI service that accepts log packets
/distributor     – Akka HTTP application distributing packets to analysers
/frontend        – React + TypeScript web interface (Vite)
/prometheus      – example Prometheus configuration (currently unused)
/locustfile.py   – Locust load‑testing script