logdistributor
Log Distributor
Architecture Overview
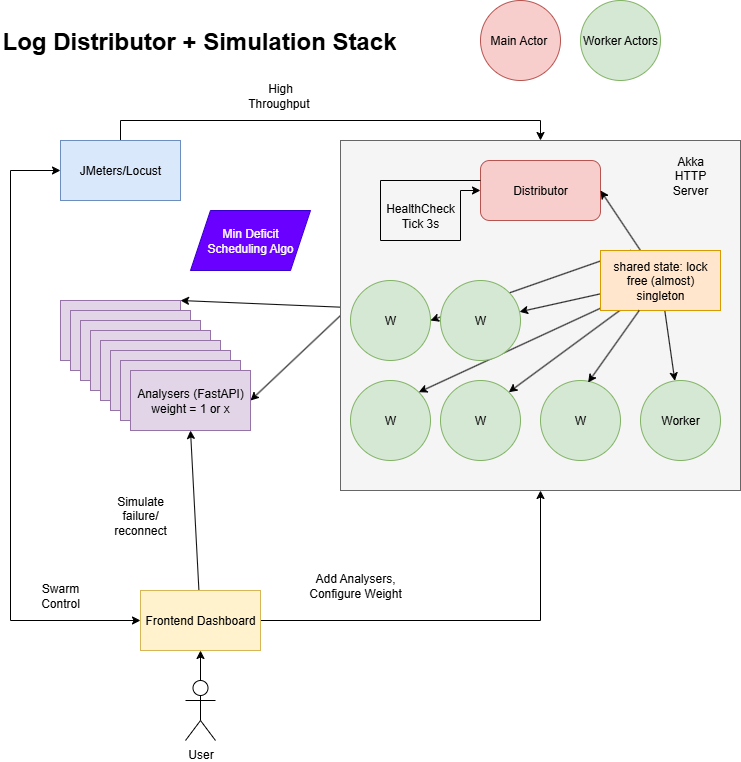
The above diagram illustrates the architecture of the Log Distributor system. It consists of a central distributor service that routes log packets to multiple analysers, each capable of processing and monitoring logs. The frontend provides a user interface for interaction, while the load testing is handled by Locust. JMeter can be used as an alternative for load testing; the Test Plan.jmx file contains a sample configuration.
Distributor
An Akka HTTP service that routes log packets to multiple analysers for processing. One main distributor actor is responsible for receiving incoming requests, routes them worker actors that handle the actual distribution logic. The main distributor actor also monitors the health of analysers that are down or unreachable to check if they can be re-registered.
Each worker is responsible for checking if the analyser is healthy and then sending the packet to it. If the analyser is down, the worker will deregister the analyser and requeue the message on itself for later processing. The workers are designed to handle the weighted round-robin distribution of packets based on the load balancing weights assigned to each analyser.
The service has a global state which is a singleton class that uses concurrent data structures to store the registered analysers, their health status and the number of messages routed to each analyser
Routing Algorithm
The routing algorithm while refered to in the read me as deficit weighted round-robin is designed to distribute log packets evenly across all available analysers. I am not sure how similar it is to the traditional weighted round-robin algorithm, but here is a brief overview of how it works:
The algorithm uses deficit = sent - expected to track the difference between the number of packets sent to an analyser and the expected number of packets based on its weight. The analyser with the least deficit is selected to receive the next packet. If an analyser is down or unreachable, it is temporarily removed from the pool of available analysers until it is healthy again.
The traffic in global state is recorded as an atomic operation to ensure that the routing algorithm can access the most up-to-date information about the analysers and their health status. (Ensured by Scala.concurrent.TrieHashMap)
Analyser API
Simple FastAPI service that accepts log packets and exposes Prometheus metrics. Each analyser instance can be registered with the distributor, which will then route log packets to it.
Frontend
React + TypeScript + ShadCNUI + Recharts + Vite based web interface that allows users to interact with the Log Distributor system. It provides a simple UI to view the status of analysers, send log packets, and monitor the health of the system.
Docker Compose
The project uses Docker Compose to orchestrate the services. The docker-compose.yaml file defines the services, their dependencies, and how they interact with each other. It includes the distributor, multiple analysers, a frontend, and a load testing service using Locust.
Testing
Load Testing (High Throughput)
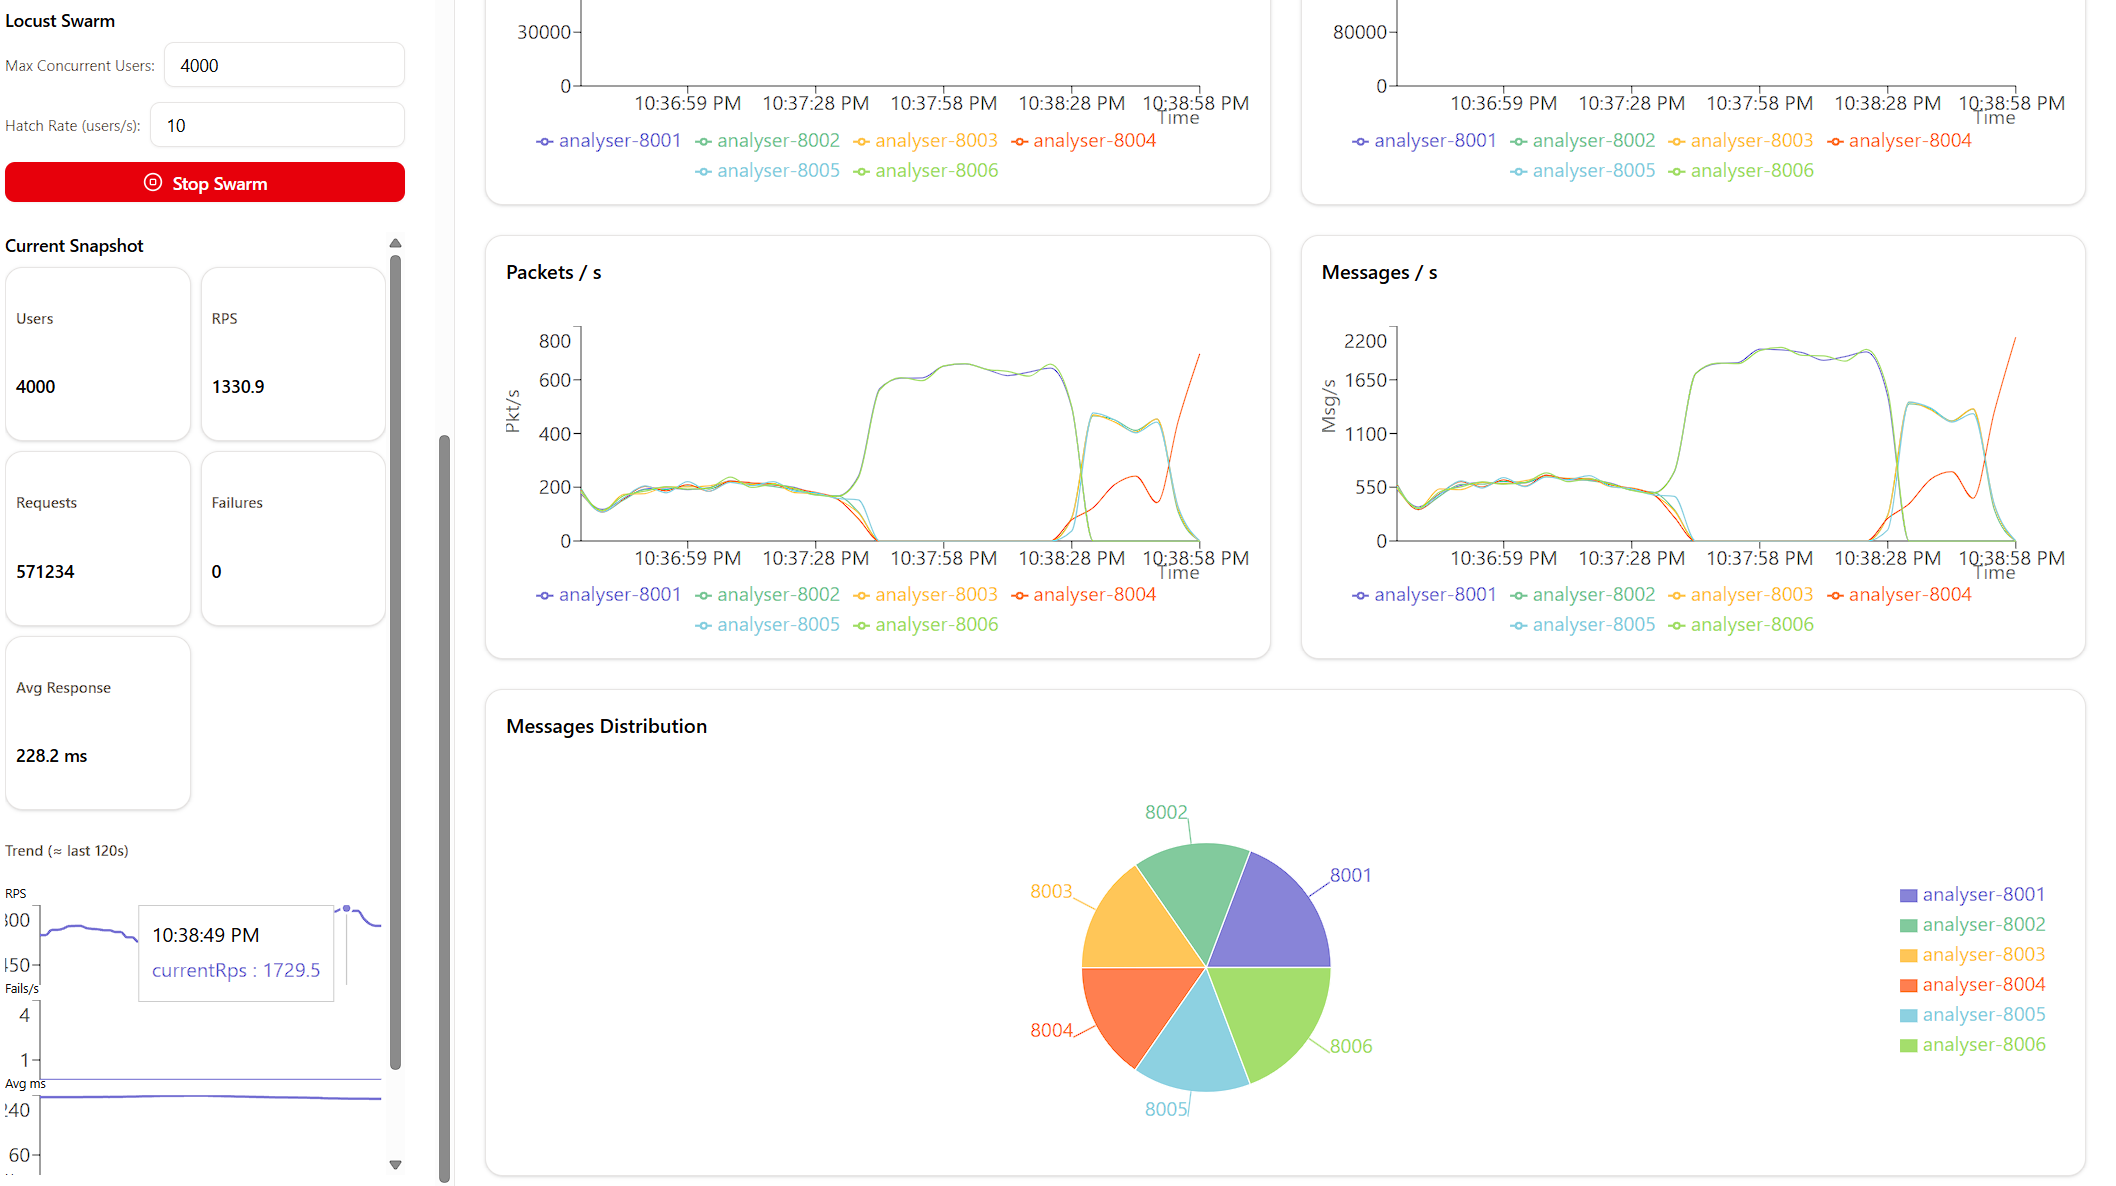
I was able to capture a maximum load of around 5000 requests per second using JMeter, the test plan is included. Using Locust(which is integrated into the Docker Compose setup) I was able to achieve a maximum of around 1800 requests per second. The load testing script is located in locustfile.py.
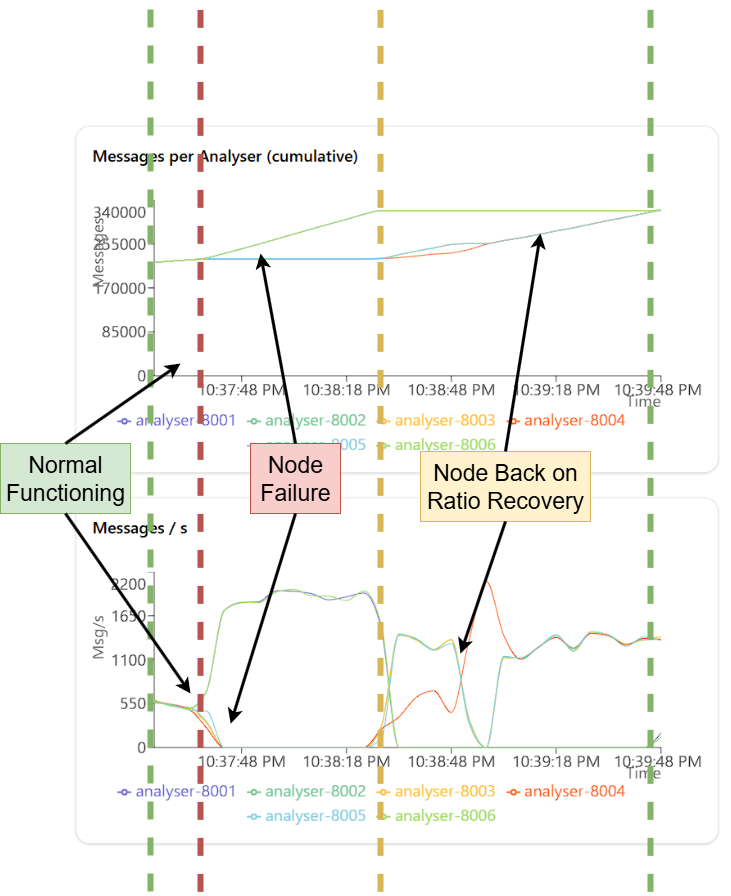
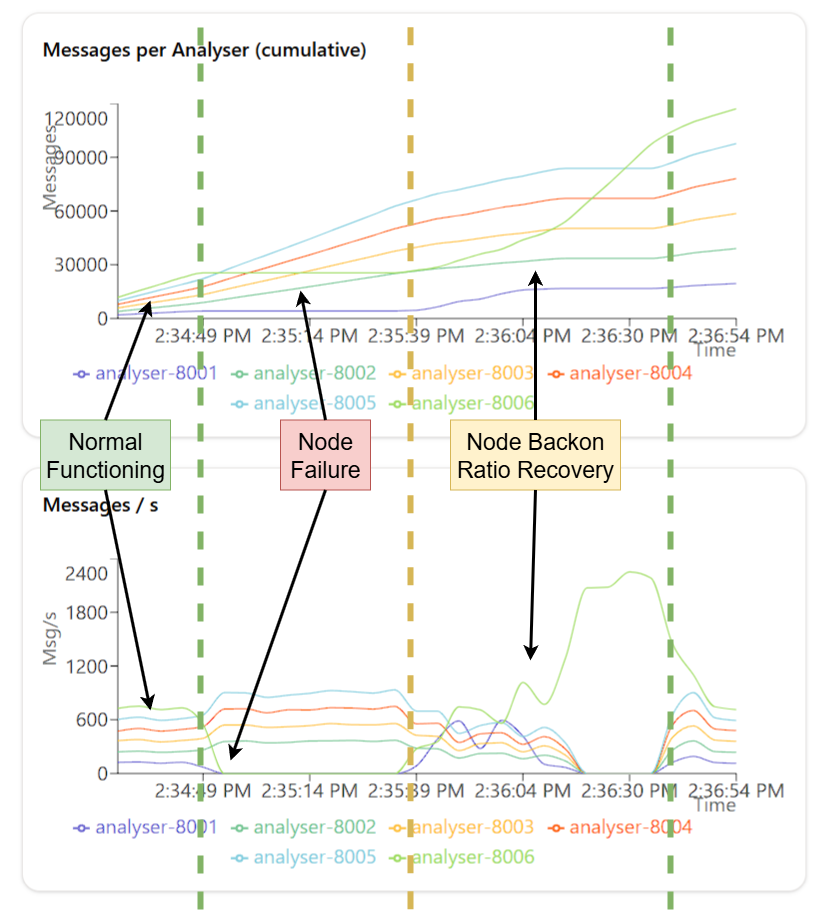
Failure and Recovery Testing
I tested the failure and recovery of analysers by simulating failures using the /internal/simulate/fail endpoint. This endpoint allows you to mark an analyser as down, and the distributor will stop routing packets to it. You can then use the /internal/simulate/begin endpoint to bring the analyser back online, and the distributor will resume routing packets to it. I tested on different ratios: 1:1 and 1:6
Throughput with Concurrent Requests
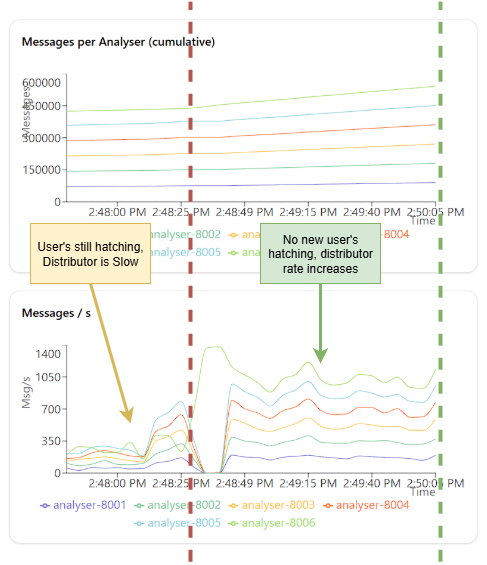
Interestingly, I observed that the throughput of the system increases when there are no new users hatching just old users putting several thousand requests. I think this may be how I have my Akka HTTP service configured, but it is worth noting that the throughput can be significantly higher when there are no new users hatching.